

Skip to
Overview
Role
User Experience Designer @ Publicis Sapient
Client
HRSA Data Warehouse (HDW)
Timeframe
10 months
Tools
Figma, Screaming Frog, Optimal Workshop, Oracle Infinity, JIRA
The Problem
HDW wanted to attract new users, but major usability issues limited its growth.
Research
Lack of a solid structure impacted opportunities to scale
Navigation issues stemmed from poor information architecture
Pages nested under multiple categories also had similar titles, causing confusion for users.
Other Key Findings
- Users bookmarked pages to avoid searching for it again.
- Site analytics show high bounce rates.
- Support emails had questions about common data sets.
I analyzed site map data and website traffic to identify outdated and popular pages.
“Make data more digestible. There’s so much data that people don’t know where to start.”
“We tried to simplify Data Explorer years ago, but in doing so, it’s not great for expert users.”
I took detailed notes during user interviews and synthesized them into insights with CX&I team.


Three value pillars emerged from 17 stakeholder interviews
- Make it easy to find what I need
- Give me the tools that are right for me
- Give me the context I need to feel confident
Many of the 29 participants wanted the data to be more accessible for the general public. However, it was still crucial that core functionalities remained the same for the frequent users.
Design
How might we balance business needs with end-users’ needs?
The Expert User

Age: 36
Role: Data Analyst
Goal: Paul needs to find funding data on HDW for a HRSA program. He’s making a report on the program’s impact on select population groups. He wants to quickly get in and get out.
The Novice User

Age: 24
Role: Potential Grantee
Goal: Jennifer stumbles upon HDW while researching HRSA grant eligibility. She wants more details on local HRSA funding, but she’s confused on where to begin.
Better callouts to guide novice users
Resource links were scattered all over the place. I introduced callout components to centralize information, orienting new users quicker.

Value Pillar: Give me the context I need to feel confident
I recommended content for the callout components.
A desktop-first approach tailored for expert users
Less than 1% of users accessed the site via mobile, so we prioritized desktop designs for expert users such as internal government employees and researchers.
Value Pillar: Give me the tools that are right for me
I designed responsive low-fidelity and high-fidelity mockups. I suggested dismissible banners to inform mobile users.
Testing & Results
A strong design foundation to support the growing data library
29
participants, representing 10 bureaus
17
usability testing sessions
7
pages of low-fidelity mockups tested
1
new design system
I led some usability sessions, and I put together the prototype.
View Prototype


Expert users wanted less scrolling
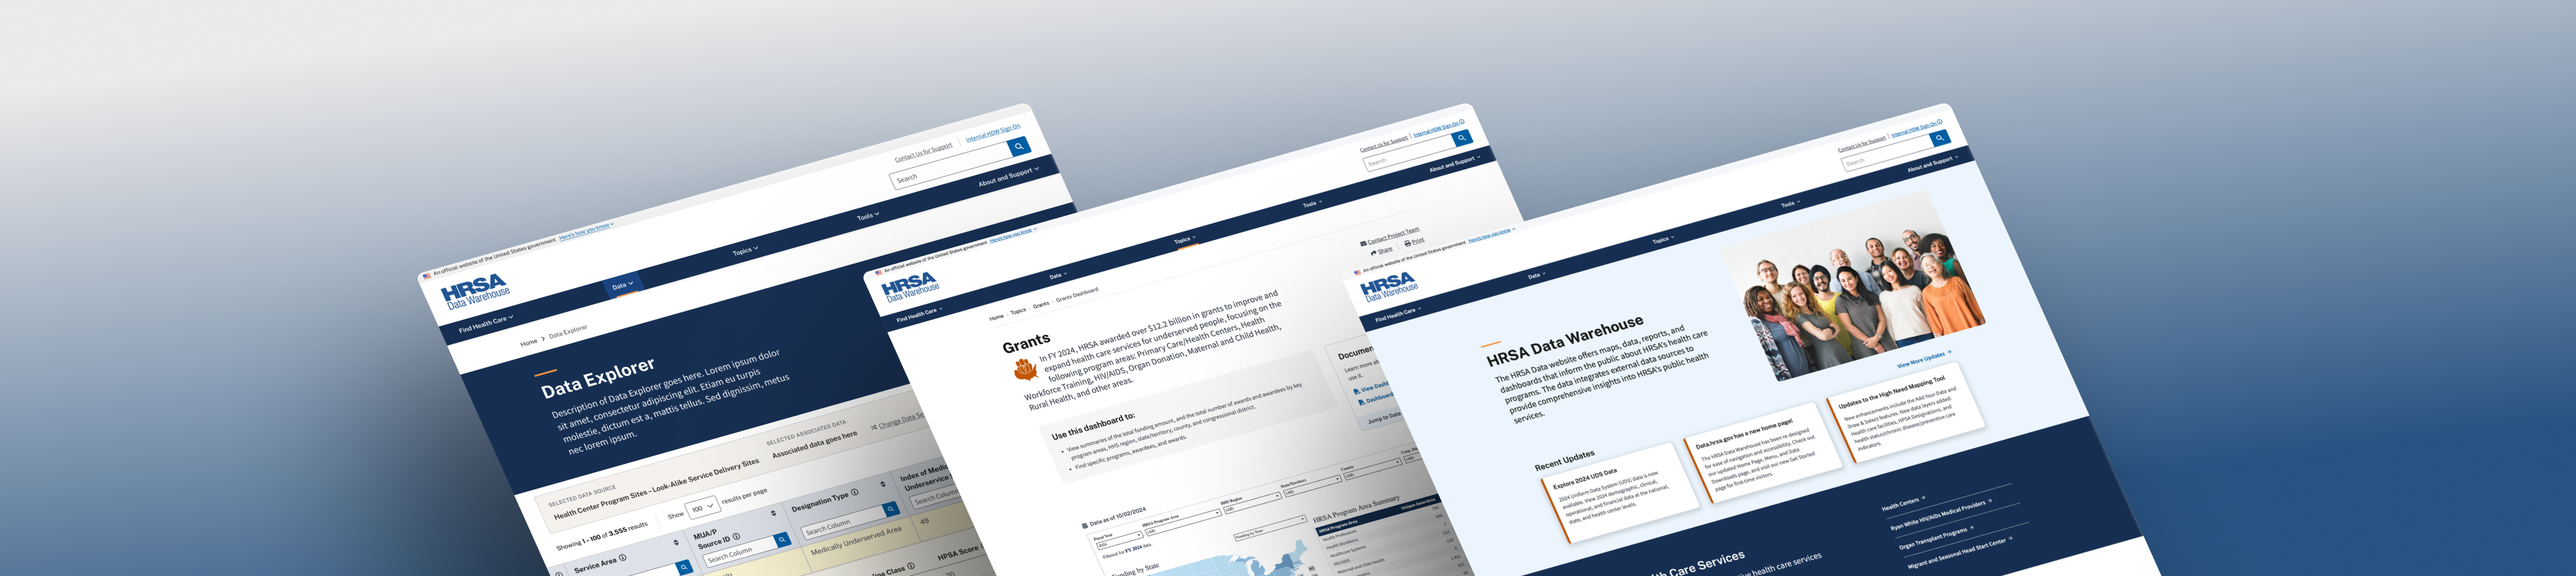
We conducted usability testing on low-fidelity wireframes for key new pages like Topic Landing Page, Dashboard Wrapper, and the Data Explorer tool.
We received positive and helpful feedback that we used for the high-fidelity wireframes.
“This design is very friendly to people who are unfamiliar with HRSA or its data.”
Advocating for novice users despite pushback
Beforehand, pages were built for advanced users where they can get in and get out (once they learned how to navigate it). Now, pages are more spaced out to give breathing room and allow users to discover information gradually (via progressive disclosure).
Before
Grants Dashboard Page
Data Downloads Page
After
Skip to
Overview
Role
User Experience Designer @ Publicis Sapient
Client
HRSA Data Warehouse (HDW)
Timeframe
10 months
Tools
Figma, Screaming Frog, Optimal Workshop, Oracle Infinity, JIRA
The Problem
HDW wanted to attract new users, but major usability issues limited its growth.
Research
Lack of a solid structure impacted opportunities to scale
Navigation issues stemmed from poor information architecture
Pages nested under multiple categories also had similar titles, causing confusion for users.
Other Key Findings
- Users bookmarked pages to avoid searching for it again.
- Site analytics show high bounce rates.
- Support emails had questions about common data sets.
I analyzed site map data and website traffic to identify outdated and popular pages.
“Make data more digestible. There’s so much data that people don’t know where to start.”
“We tried to simplify Data Explorer years ago, but in doing so, it’s not great for expert users.”
I took detailed notes during user interviews and synthesized them into insights with CX&I team.
Three value pillars emerged from 17 stakeholder interviews
- Make it easy to find what I need
- Give me the tools that are right for me
- Give me the context I need to feel confident
Many of the 29 participants wanted the data to be more accessible for the general public. However, it was still crucial that core functionalities remained the same for the frequent users.
Design
How might we balance business needs with end-users’ needs?
The Expert User
Age: 36
Role: Data Analyst
Goal: Paul needs to find funding data on HDW for a HRSA program. He’s making a report on the program’s impact on select population groups. He wants to quickly get in and get out.
The Novice User
Age: 24
Role: Potential Grantee
Goal: Jennifer stumbles upon HDW while researching HRSA grant eligibility. She wants more details on local HRSA funding, but she’s confused on where to begin.
Better callouts to guide novice users
Resource links were scattered all over the place. I introduced callout components to centralize information, orienting new users quicker.
Value Pillar: Give me the context I need to feel confident
I recommended content for the callout components.
A desktop-first approach tailored for expert users
Less than 1% of users accessed the site via mobile, so we prioritized desktop designs for expert users such as internal government employees and researchers.
Value Pillar: Give me the tools that are right for me
I designed responsive low-fidelity and high-fidelity mockups. I suggested dismissible banners to inform mobile users.
Testing & Results
A strong design foundation to support the growing data library
29
participants, representing 10 bureaus
17
usability testing sessions
7
pages of low-fidelity mockups tested
1
new design system
Expert users wanted less scrolling
We conducted usability testing on low-fidelity wireframes for key new pages like Topic Landing Page, Dashboard Wrapper, and the Data Explorer tool.
We received positive and helpful feedback that we used for the high-fidelity wireframes.
I led some usability sessions, and I put together the prototype.
View Prototype
“This design is very friendly to people who are unfamiliar with HRSA or its data.”
Advocating for novice users despite pushback
Beforehand, pages were built for advanced users where they can get in and get out (once they learned how to navigate it). Now, pages are more spaced out to give breathing room and allow users to discover information gradually (via progressive disclosure).
Before
Grants Dashboard Page
Data Downloads Page
After
Skip to
- Current state audit
- Landscape review
- Stakeholder interviews
- Website analytics
- Sitemap analysis
- Low-fidelity mockups
- High-fidelity mockups
- Design system
- Client design reviews
- Tech feasibility
- Prototyping
- Card-sort
- Usability testing
- Hand-off
Overview
Role
User Experience Designer @ Publicis Sapient
Client
HRSA Data Warehouse (HDW)
Timeframe
10 months
Tools
Figma, Screaming Frog, Optimal Workshop, Oracle Infinity, JIRA
The Problem
HDW wanted to attract new users, but major usability issues limited its growth.
Research
Lack of a solid structure impacted opportunities to scale
Navigation issues stemmed from poor information architecture
Pages nested under multiple categories also had similar titles, causing confusion for users.
Other Key Findings
- Users bookmarked pages to avoid searching for it again.
- Site analytics show high bounce rates.
- Support emails had questions about common data sets.
I analyzed site map data and website traffic to identify outdated and popular pages.
“Make data more digestible. There’s so much data that people don’t know where to start.”
“We tried to simplify Data Explorer years ago, but in doing so, it’s not great for expert users.”
I took detailed notes during user interviews and synthesized them into insights with CX&I team.
Three value pillars emerged from 17 stakeholder interviews
- Make it easy to find what I need
- Give me the tools that are right for me
- Give me the context I need to feel confident
Many of the 29 participants wanted the data to be more accessible for the general public. However, it was still crucial that core functionalities remained the same for the frequent users.
Design
How might we balance business needs with end-users’ needs?
The Expert User
Age: 36
Role: Data Analyst
Goal: Paul needs to find funding data on HDW for a HRSA program. He’s making a report on the program’s impact on select population groups. He wants to quickly get in and get out.
The Novice User
Age: 24
Role: Potential Grantee
Goal: Jennifer stumbles upon HDW while researching HRSA grant eligibility. She wants more details on local HRSA funding, but she’s confused on where to begin.
Better callouts to guide novice users
Resource links were scattered all over the place. I introduced callout components to centralize information, orienting new users quicker.
Value Pillar: Give me the context I need to feel confident
I recommended content for the callout components.
A desktop-first approach tailored for expert users
Less than 1% of users accessed the site via mobile, so we prioritized desktop designs for expert users such as internal government employees and researchers.
Value Pillar: Give me the tools that are right for me
I designed responsive low-fidelity and high-fidelity mockups. I suggested dismissible banners to inform mobile users.
Testing & Results
A strong design foundation to support the growing data library
29
participants, representing 10 bureaus
17
usability testing sessions
7
pages of low-fidelity mockups tested
1
new design system
Expert users wanted less scrolling
We conducted usability testing on low-fidelity wireframes for key new pages like Topic Landing Page, Dashboard Wrapper, and the Data Explorer tool.
We received positive and helpful feedback that we used for the high-fidelity wireframes.
I led some usability sessions, and I put together the prototype.
View Prototype
“This design is very friendly to people who are unfamiliar with HRSA or its data.”
Advocating for novice users despite pushback
Beforehand, pages were built for advanced users where they can get in and get out (once they learned how to navigate it). Now, pages are more spaced out to give breathing room and allow users to discover information gradually (via progressive disclosure).
Before
Grants Dashboard Page
Data Downloads Page
After